Azure - Log Analytic Workspace - ContainerLog Billable query not working as intended
Interesting adventure with ContainerLog Billable query to obtain actual usage per Namespace Link to heading
Most probably you activated Container Insights with ContainerLogs on, and after a month or so you are trying to figure out which Namespace/Container is in charge for the majority of the ingestion costs. Hope you are here since you noticed that Microsoft provided queries for Containers such as “Billable Log Data by log-type” or “Billable Log Data per namespace” are giving very inconsistent and most importantly wrong results that can’t be matched with what you see in Usage for ContainerLog.
There is good news for you then, as there is a workaround to get those two queries right (just scroll down a bit), and the bad one well you had to search for it on the internet instead of MS fixing their example, so shout out to MS please fix this two queries and double-check rest of the examples!
So let’s start with one of them:
// Billable Log Data per-namespace
// See container logs billable data for the last 7d, segregated by namespace.
let billableTimeView = 7d; // Set the requested time - 30d can take some time.
ContainerLog
|join(KubePodInventory | where TimeGenerated > startofday(ago(billableTimeView)))
on ContainerID
|where TimeGenerated > startofday(ago(billableTimeView))
| summarize Total=sum(_BilledSize)/ 1000 by bin(TimeGenerated, 1d), Namespace
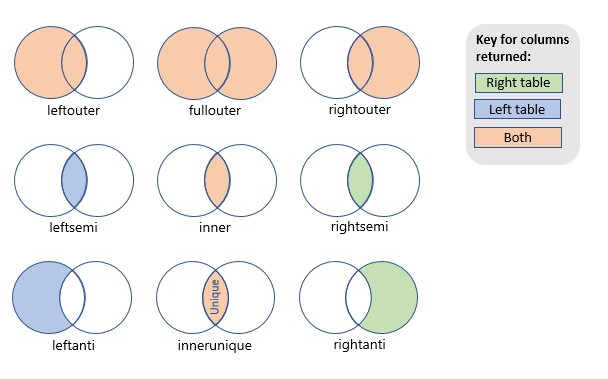
As you can see on the first highlighted line 5 someone at MS thought that using join without specifying kind, and even with default innerunique between ContainerLog and KubePodInventory will not create issues…

How innerunique works under the hood
Challenge Link to heading
Even though you might think that join will default to InnerUnique, which is also something the query editor warns you when you leave join without a kind parameter
The default join behavior may be unexpected. - that is just one of the problems.
So let’s say it will return innerunique set, and if you open the link above you will soon realize that it will not return us what we need. We need here left outer join so that we can enrich ContinerLog entries with Namespace and Name of the contianer without removing some logs in case there is no match or producing some valid “duplicates”.
Solution Link to heading
After rewriting query to optimize for speed for bigger tables ~60GB daily we can get the results that match the Usage table one ±5-10% (keep in mind this is an estimation)
// Billable Log Data per-namespace
// See container logs billable data for the last 7d, segregated by namespace.
let billableTimeView = 7d; // Set the requested time - 30d can take some time.
ContainerLog
| where TimeGenerated > startofday(ago(billableTimeView))
| summarize Total=sum(_BilledSize)/ 1024 by bin(TimeGenerated, 1d), ContainerID
| join kind=leftouter  (KubePodInventory | where TimeGenerated > startofday(ago(billableTimeView)) | distinct Namespace, Name, ContainerID  )
on ContainerID
| project TimeGenerated, Total, Namespace, Name, ContainerID- First, we changed that filtering based on time for ContainerLog is happening before rather than later as this is where you expect to get much of rows
- According to documentation best practice is that the left table has a small amount of rows compared to the right one.
- Second, we did a summarisation over usage by ContainerId before performing any join, as in the end, we want only to join additional columns to the ContainerID
- We follow best practices from the first one too with this => Fewer rows.
- Third, we optimized the join using the correct parameter kind of leftouter with distinct over Namespace, Name, ContainerID as we need only these columns
- Please extend with more columns from KubePodInventory as needed.
- The last one over there is the actual projection to return only needed columns so that we can either export it as CSV or display it as a chart.
Thanks for reading, and hope this will help you with your ContainerLog analysis journey.
Please leave a comment if something is unclear or needs a fix, feel free to share!
